Annular solar eclipse of 12/10/-1823
| Day of week: | Monday |
| Maximum duration of eclipse: | 07m48s |
| Maximum width of eclipse path: | 456 km |
| Saros cycle: | 3 |
| Coverage: | 91.4% |
| Magnitude: | 0.914 |
| Gamma: | -0.6918 |
Wo kann man die Sonnenfinsternis vom 12/10/-1823 sehen?
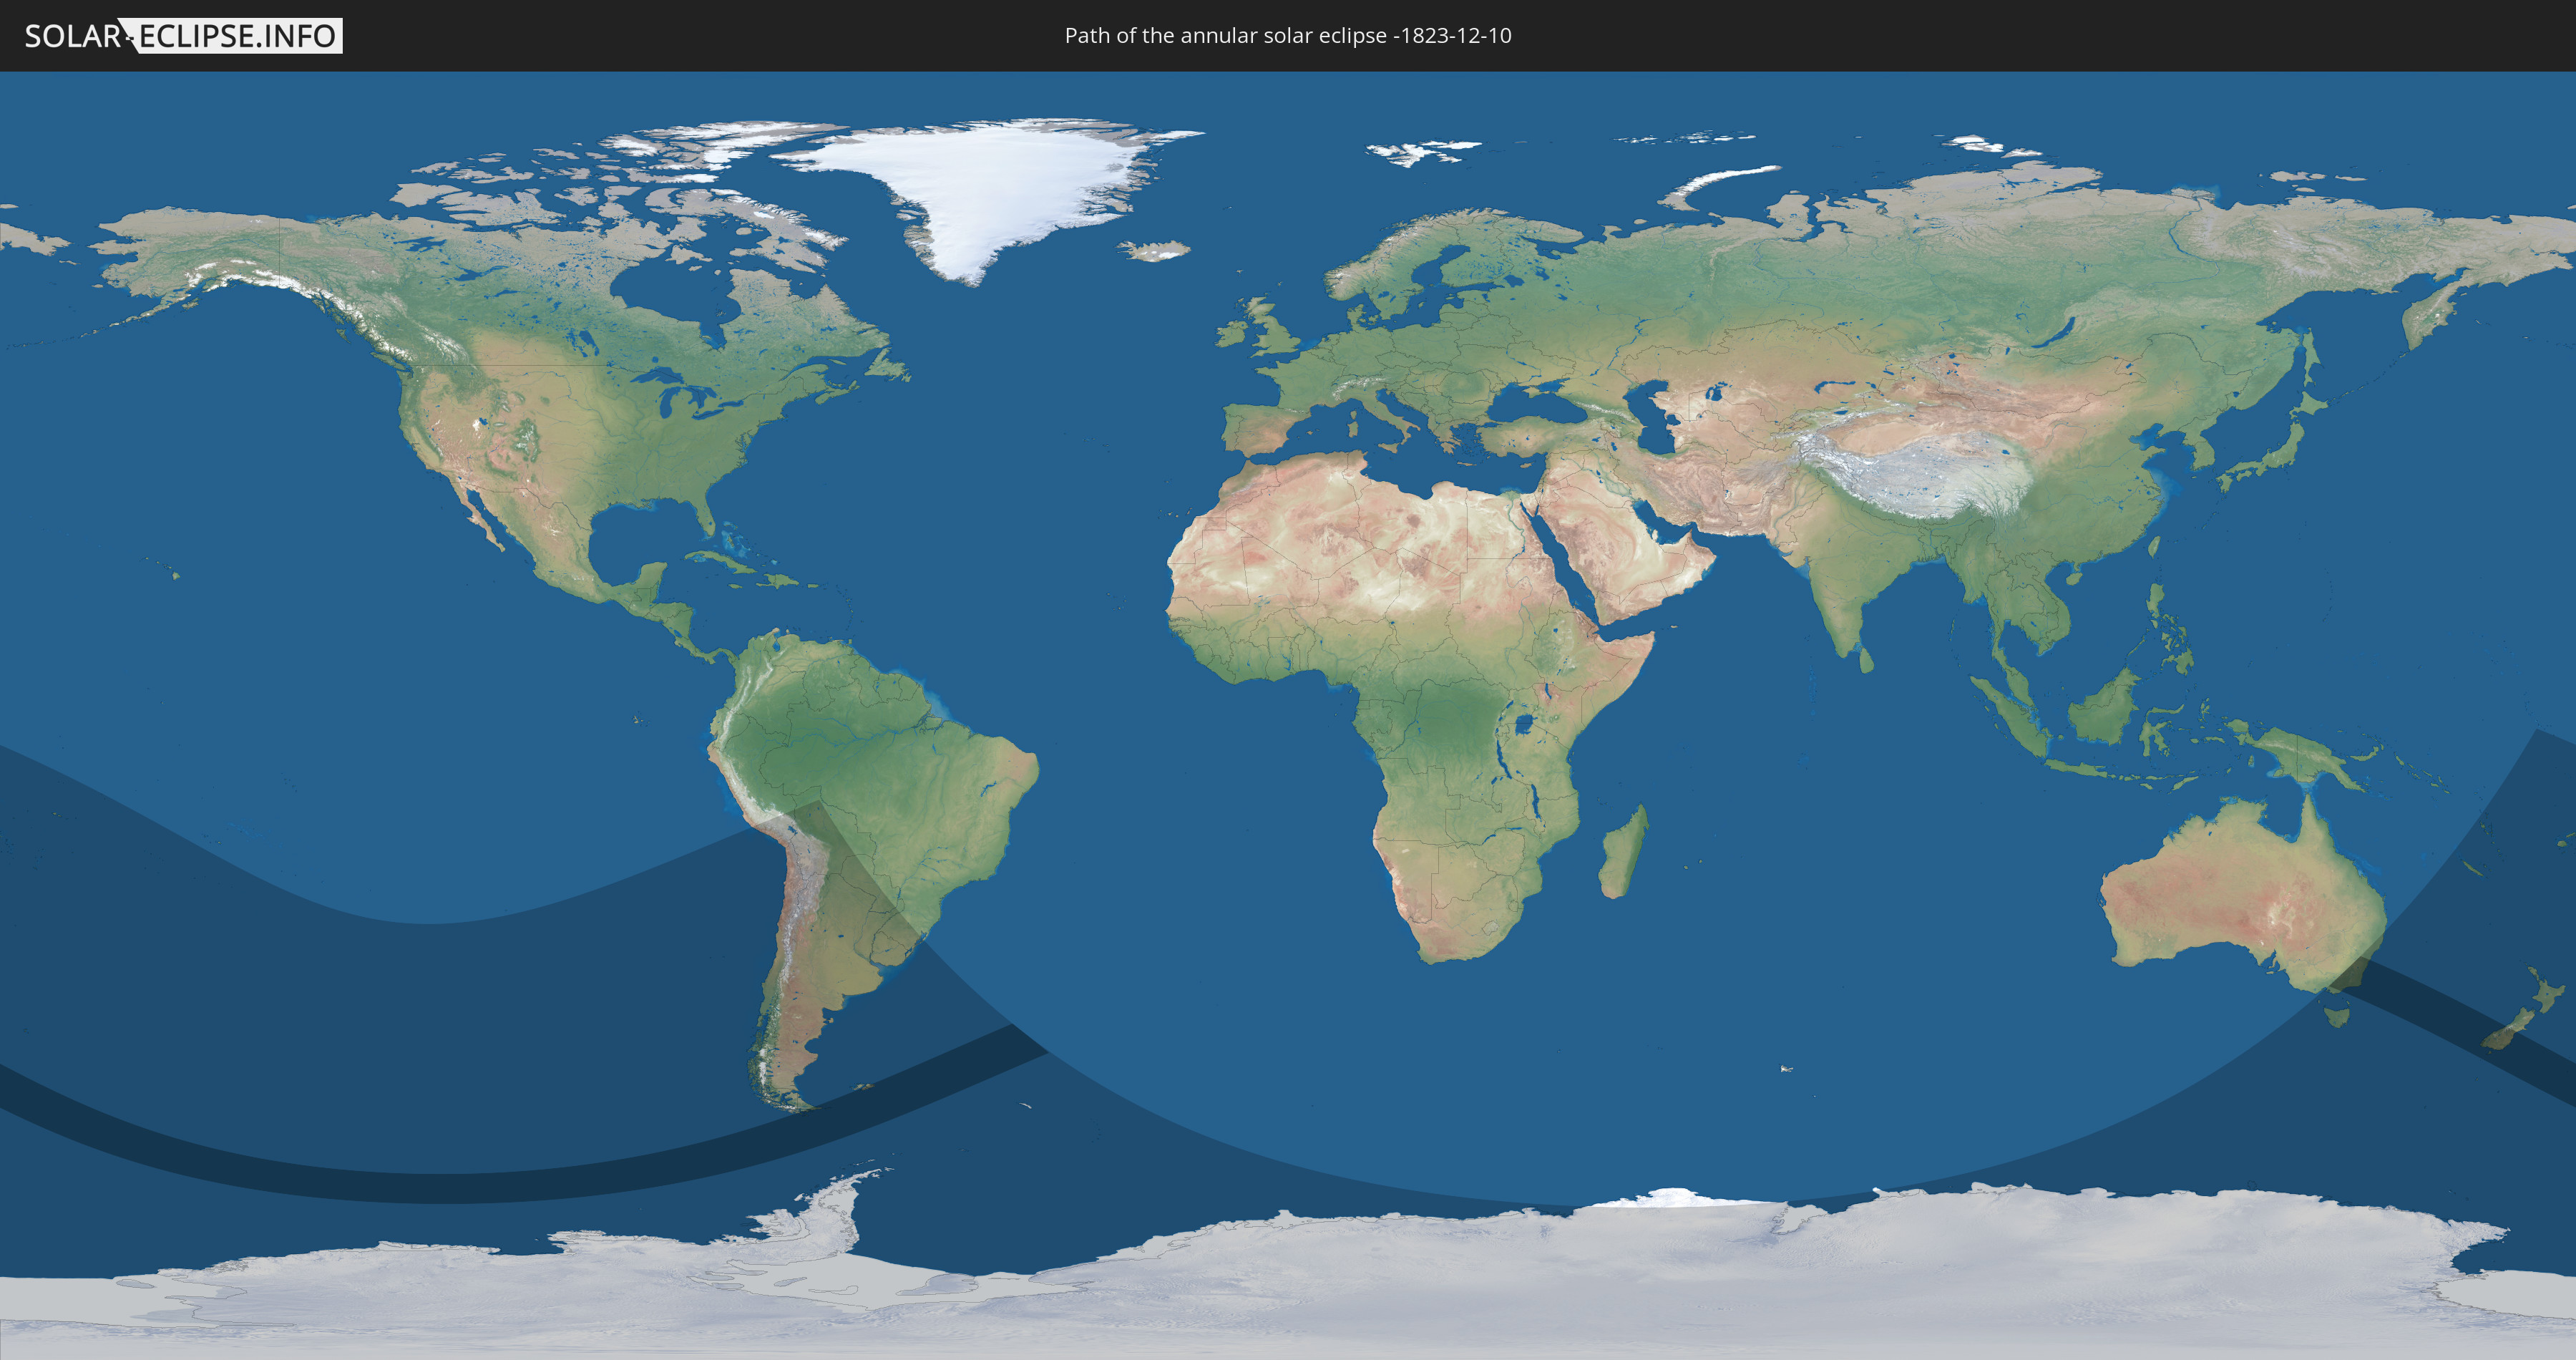
Die Sonnenfinsternis am 12/10/-1823 kann man in 27 Ländern als partielle Sonnenfinsternis beobachten.
Der Finsternispfad verläuft durch 5 Länder. Nur in diesen Ländern ist sie als annular Sonnenfinsternis zu sehen.
In den folgenden Ländern ist die Sonnenfinsternis annular zu sehen
 New Zealand
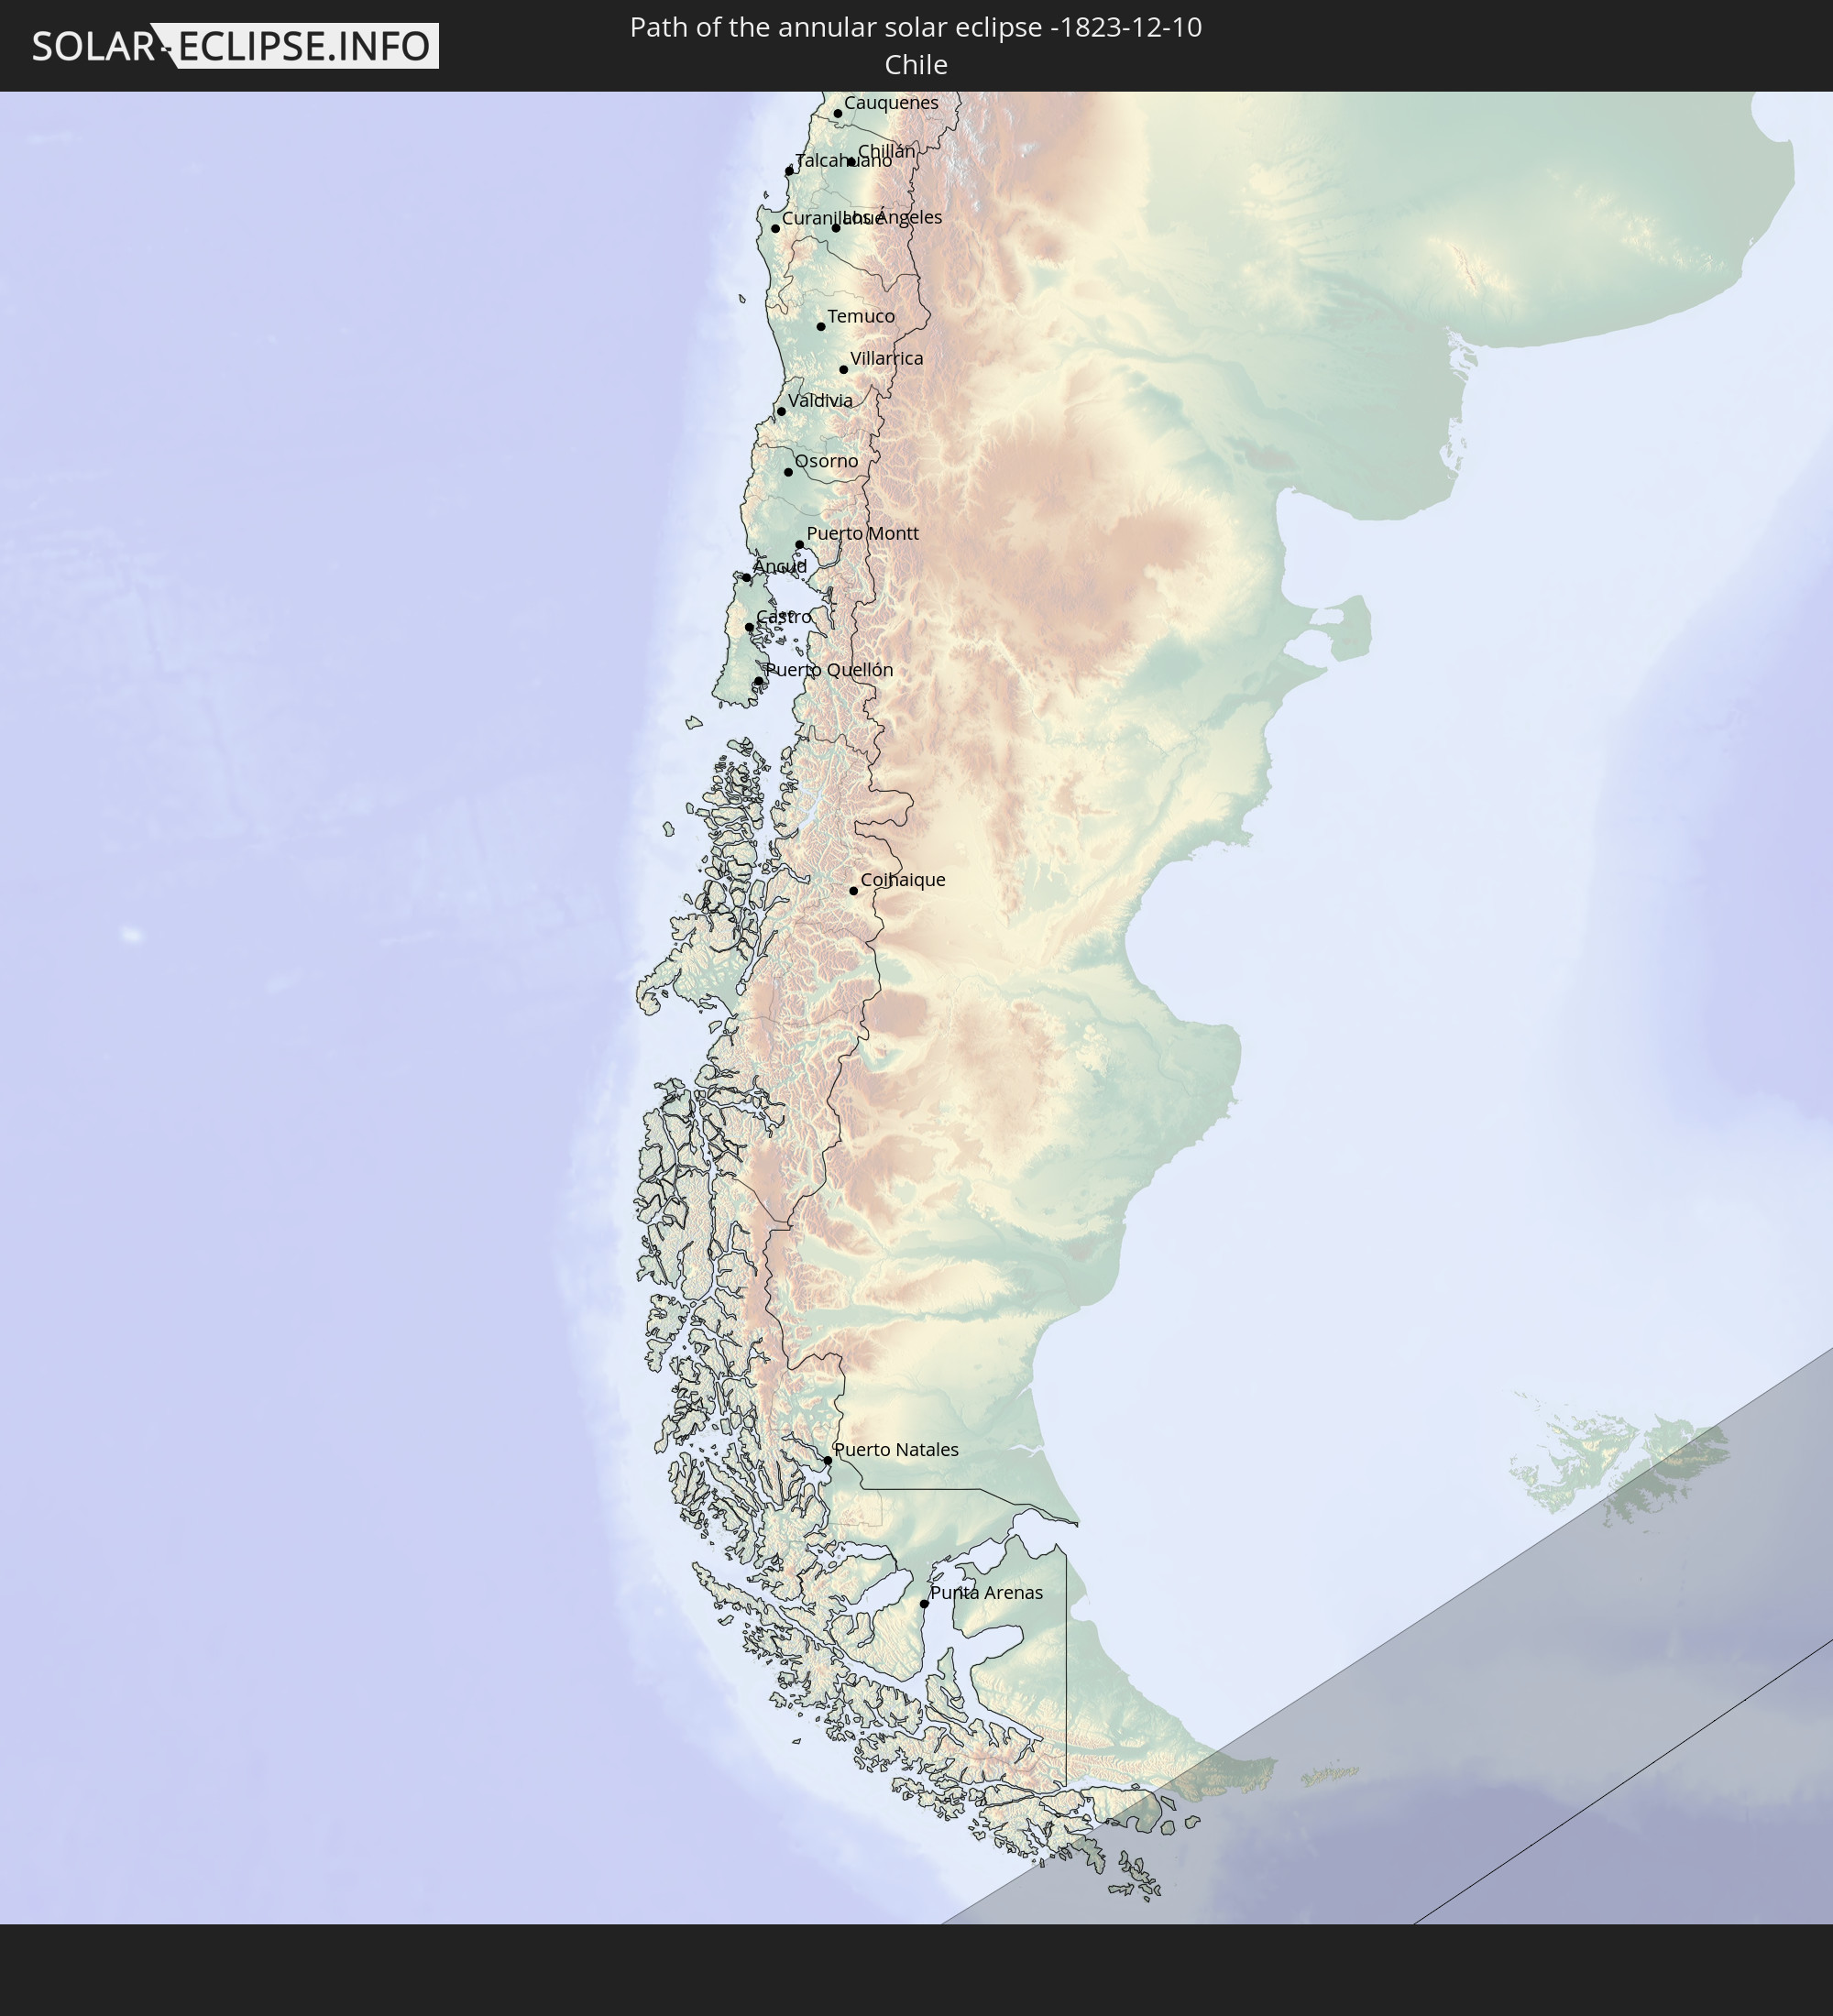 Chile
Chile
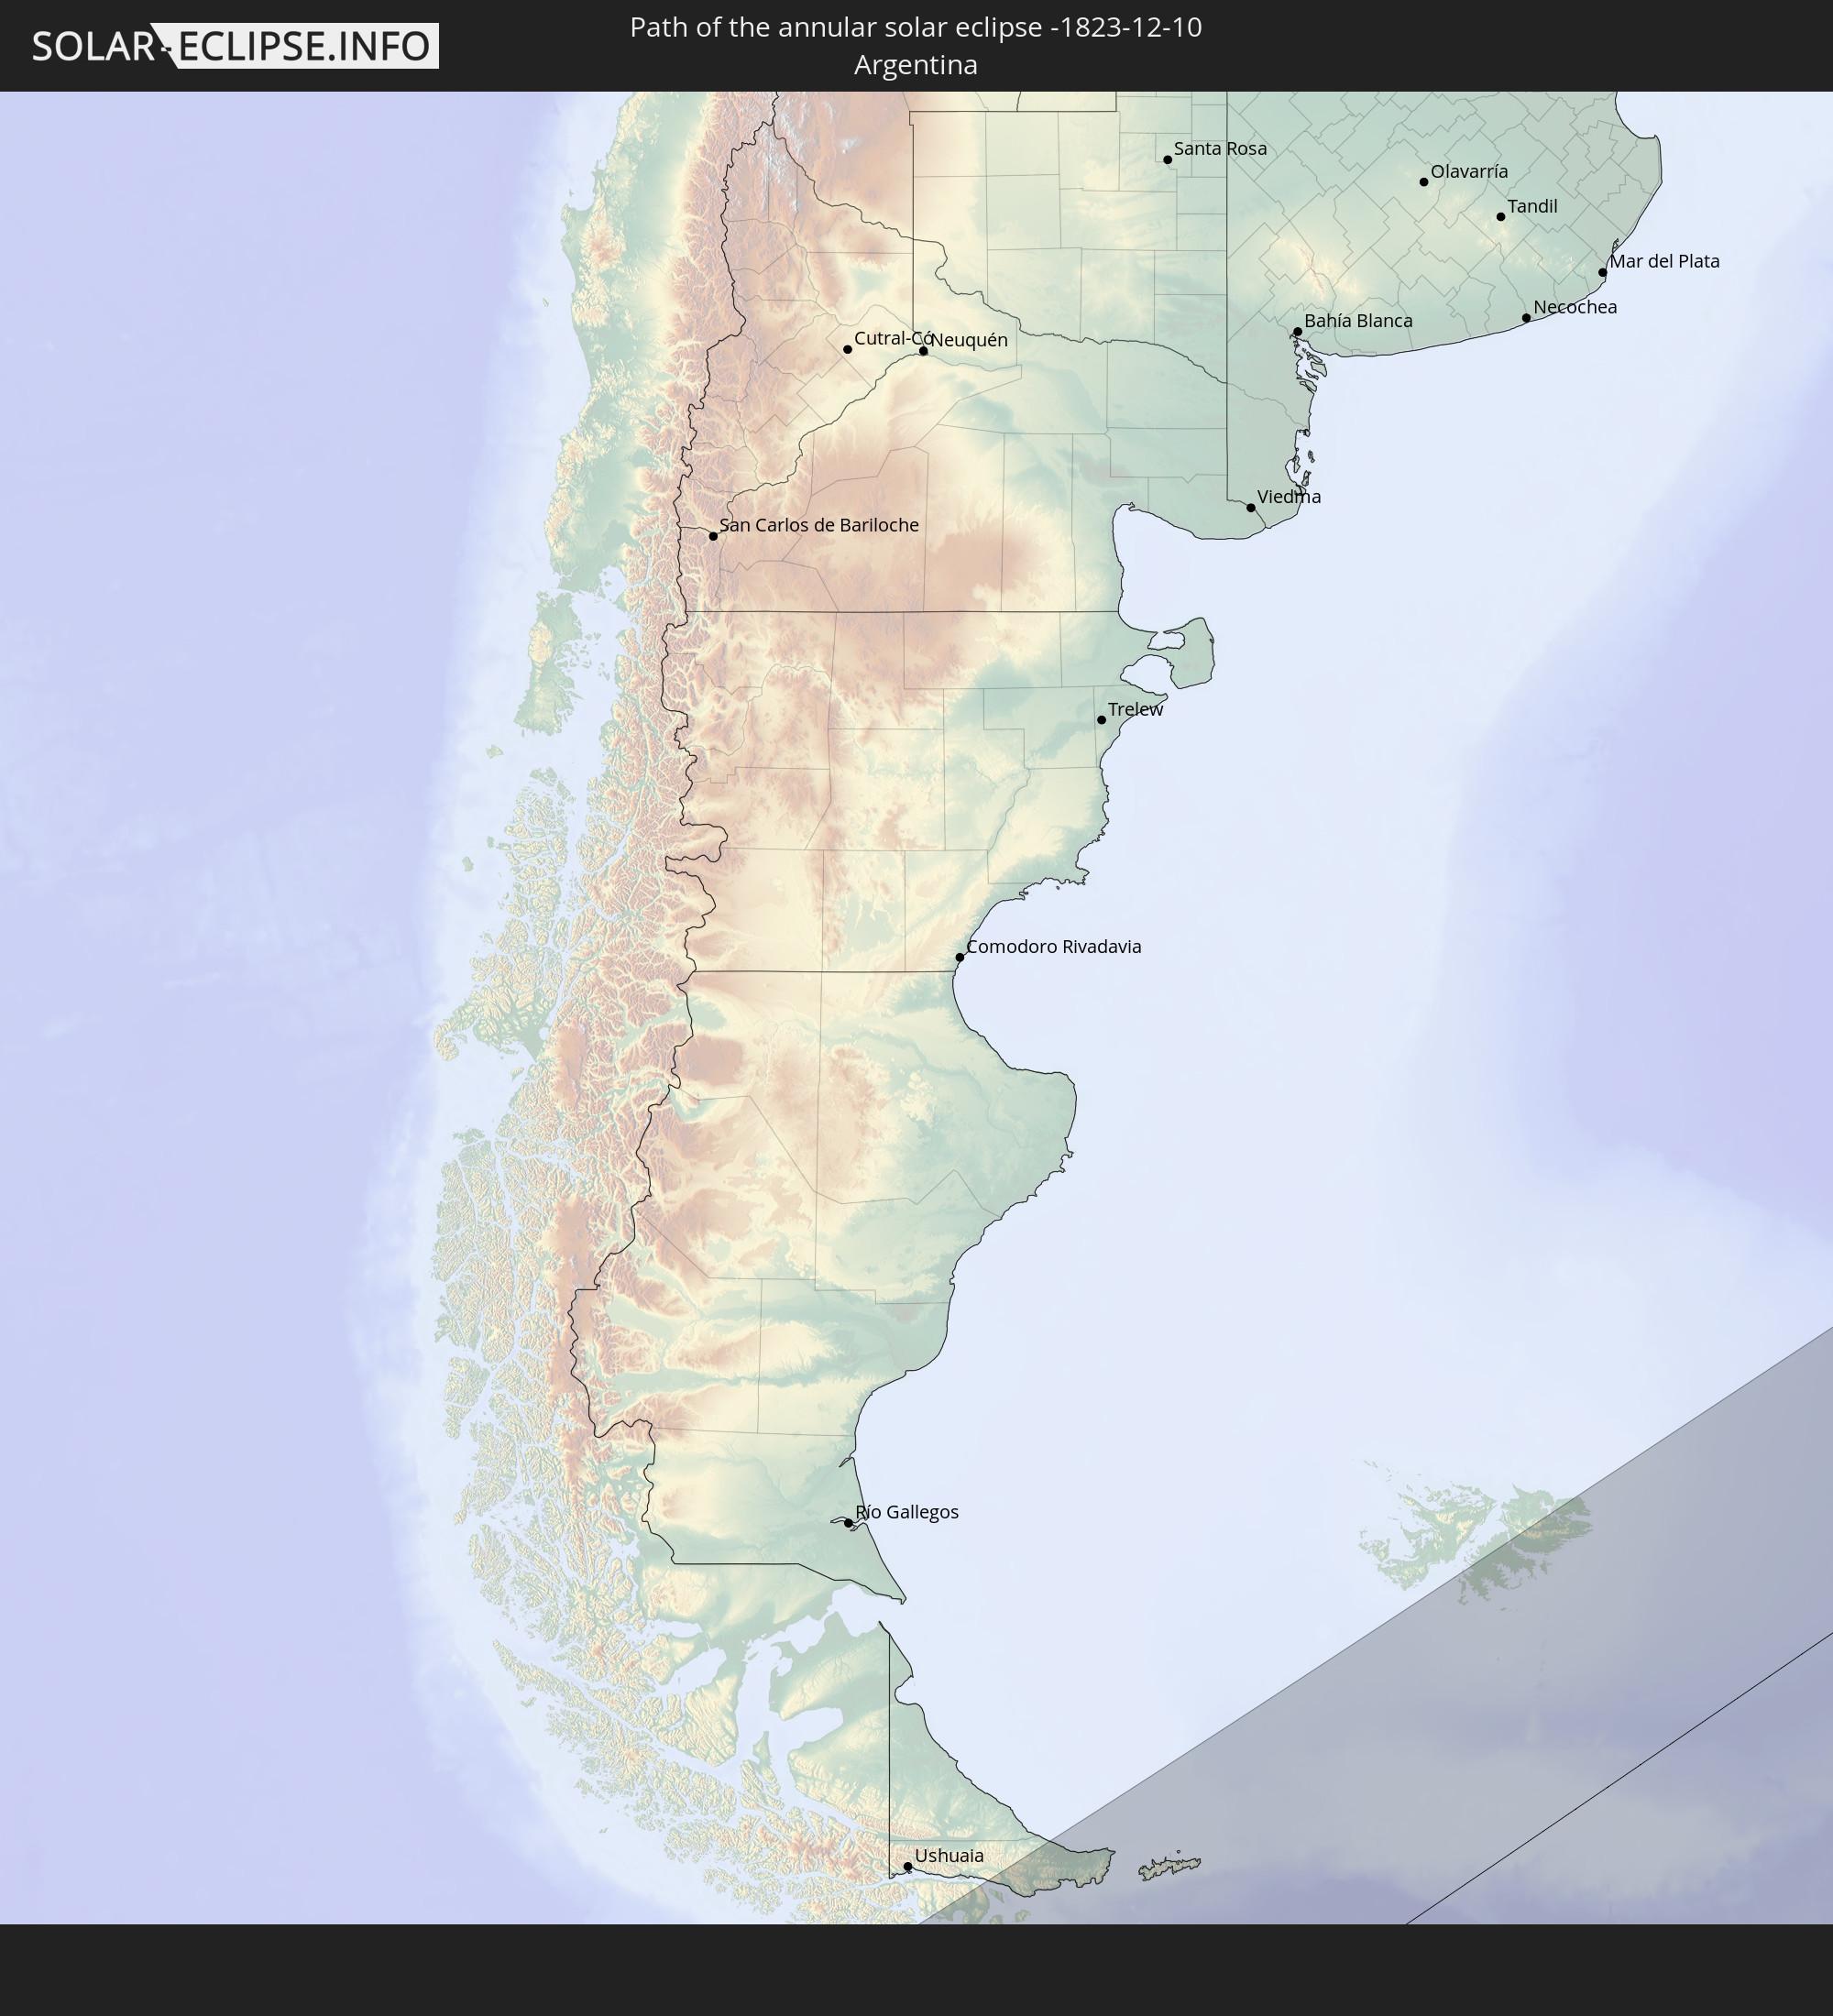 Argentina
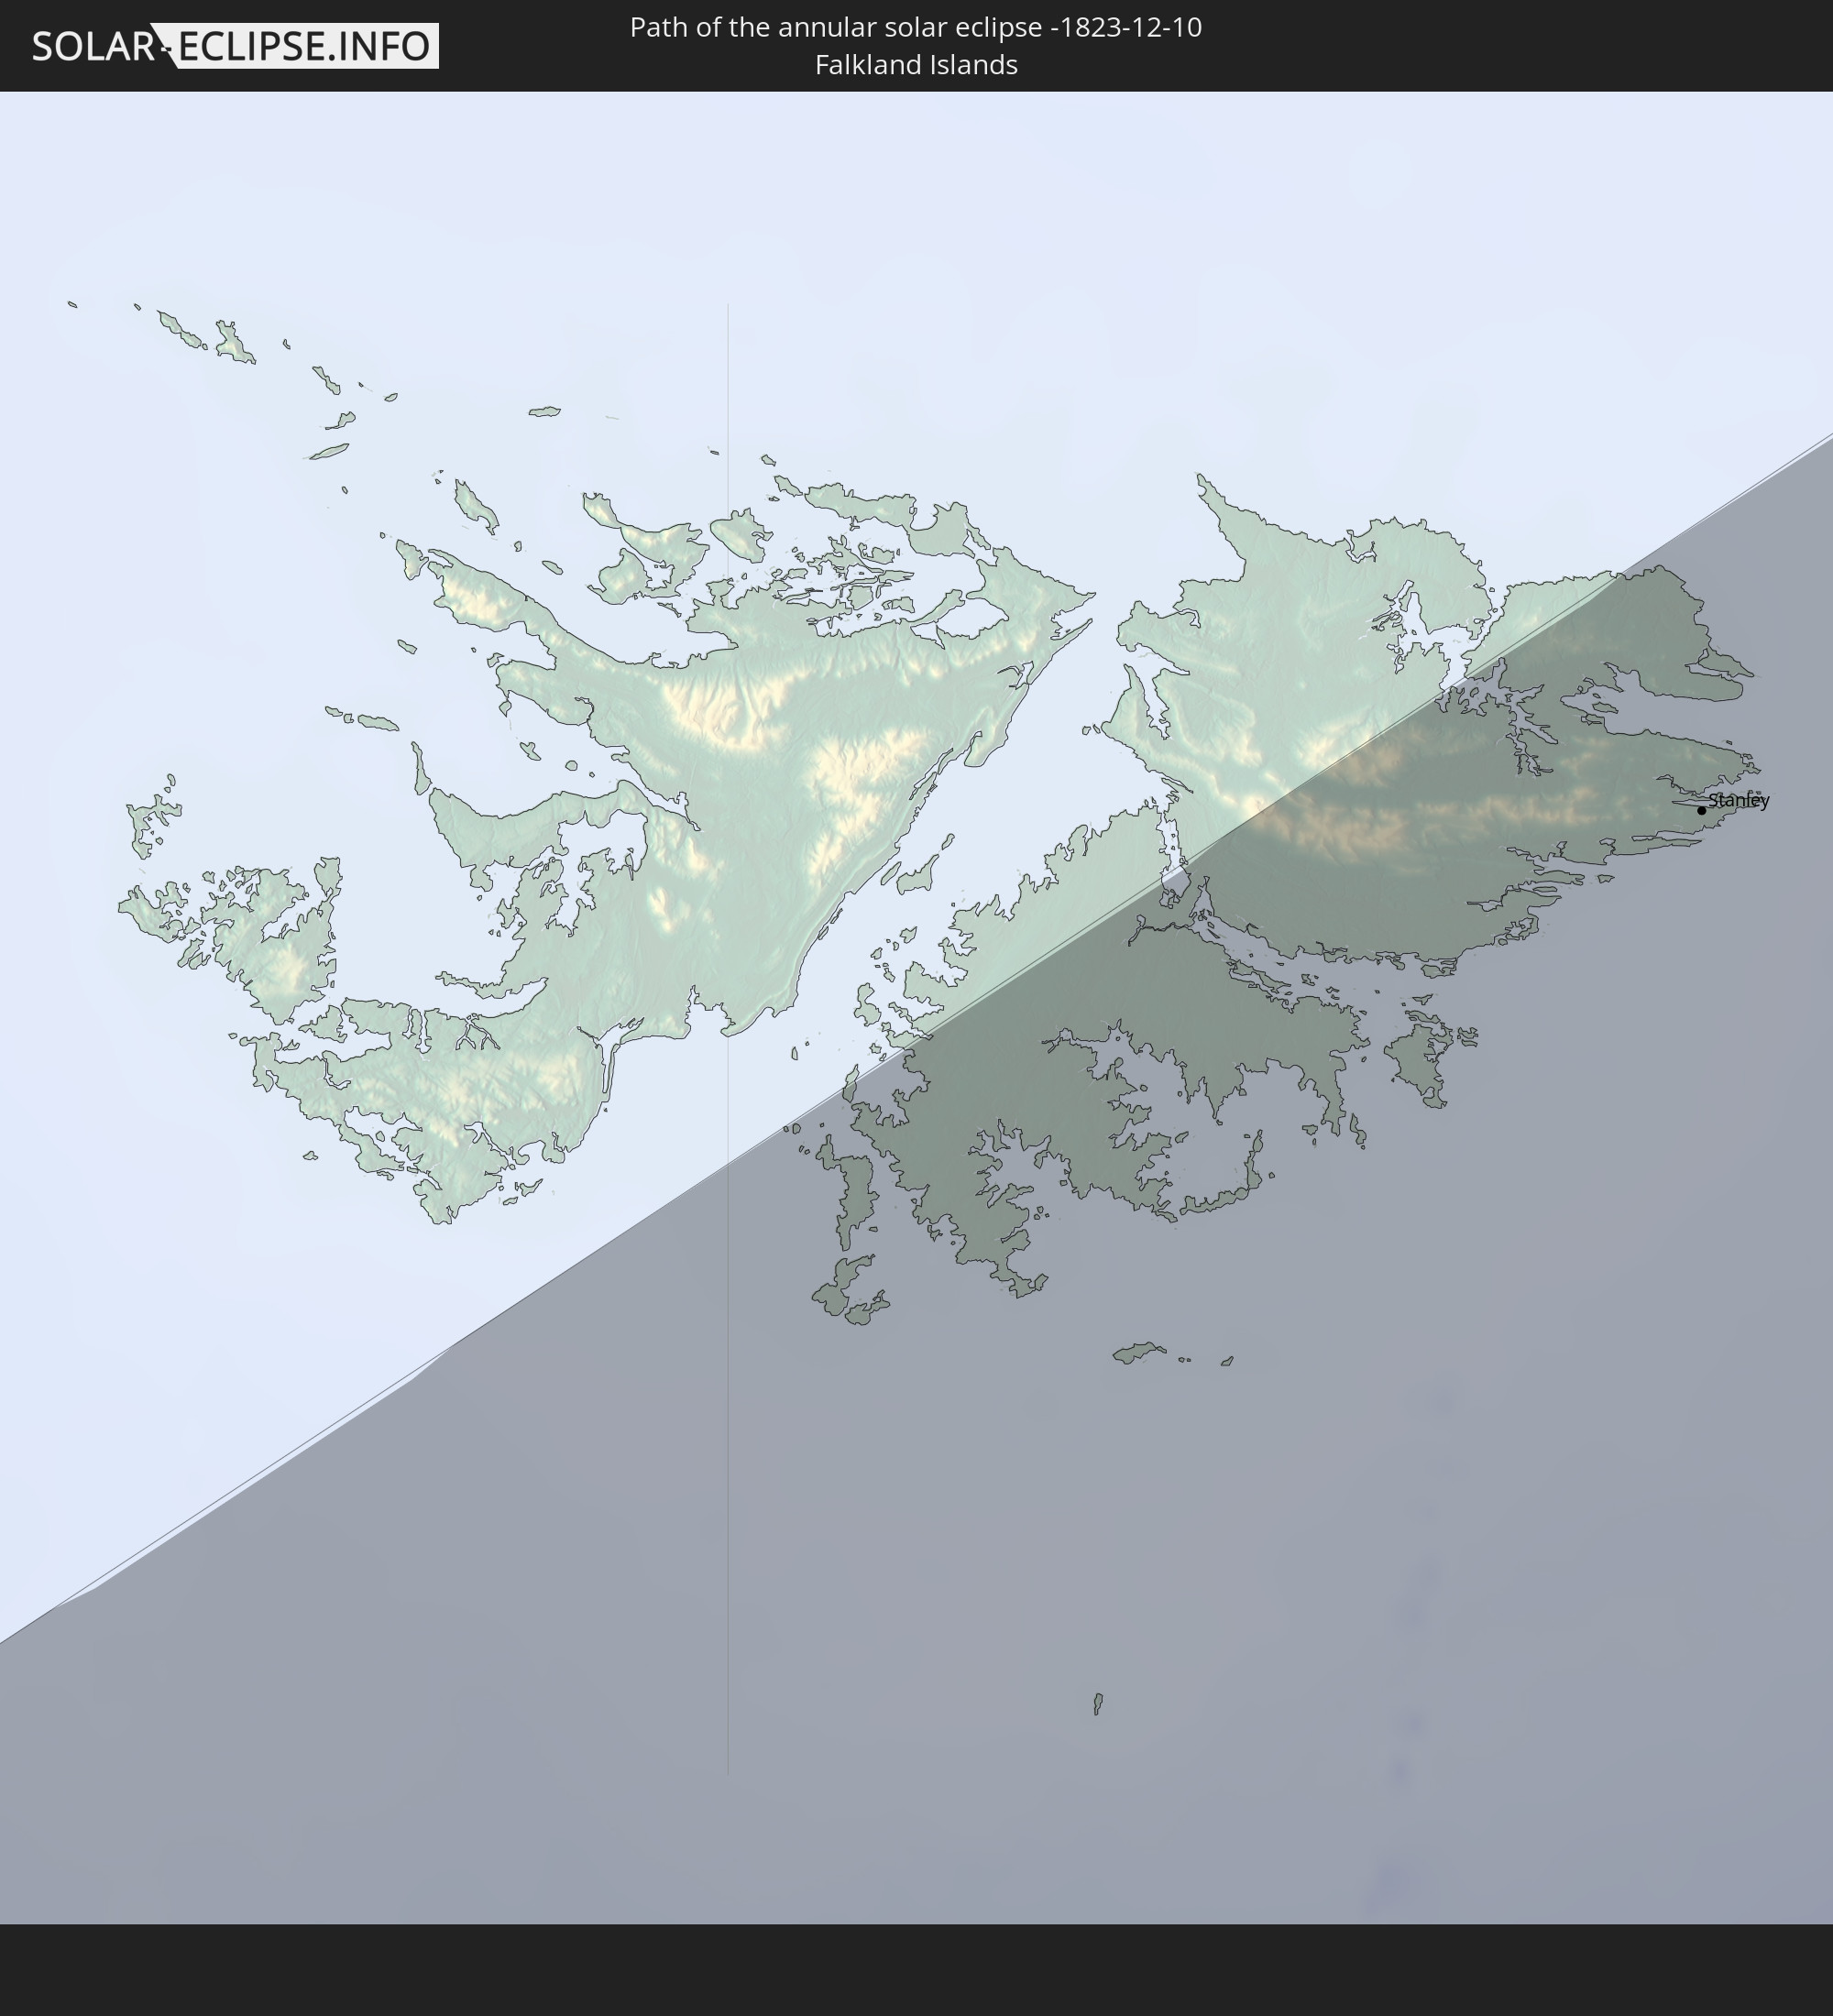 Falkland Islands
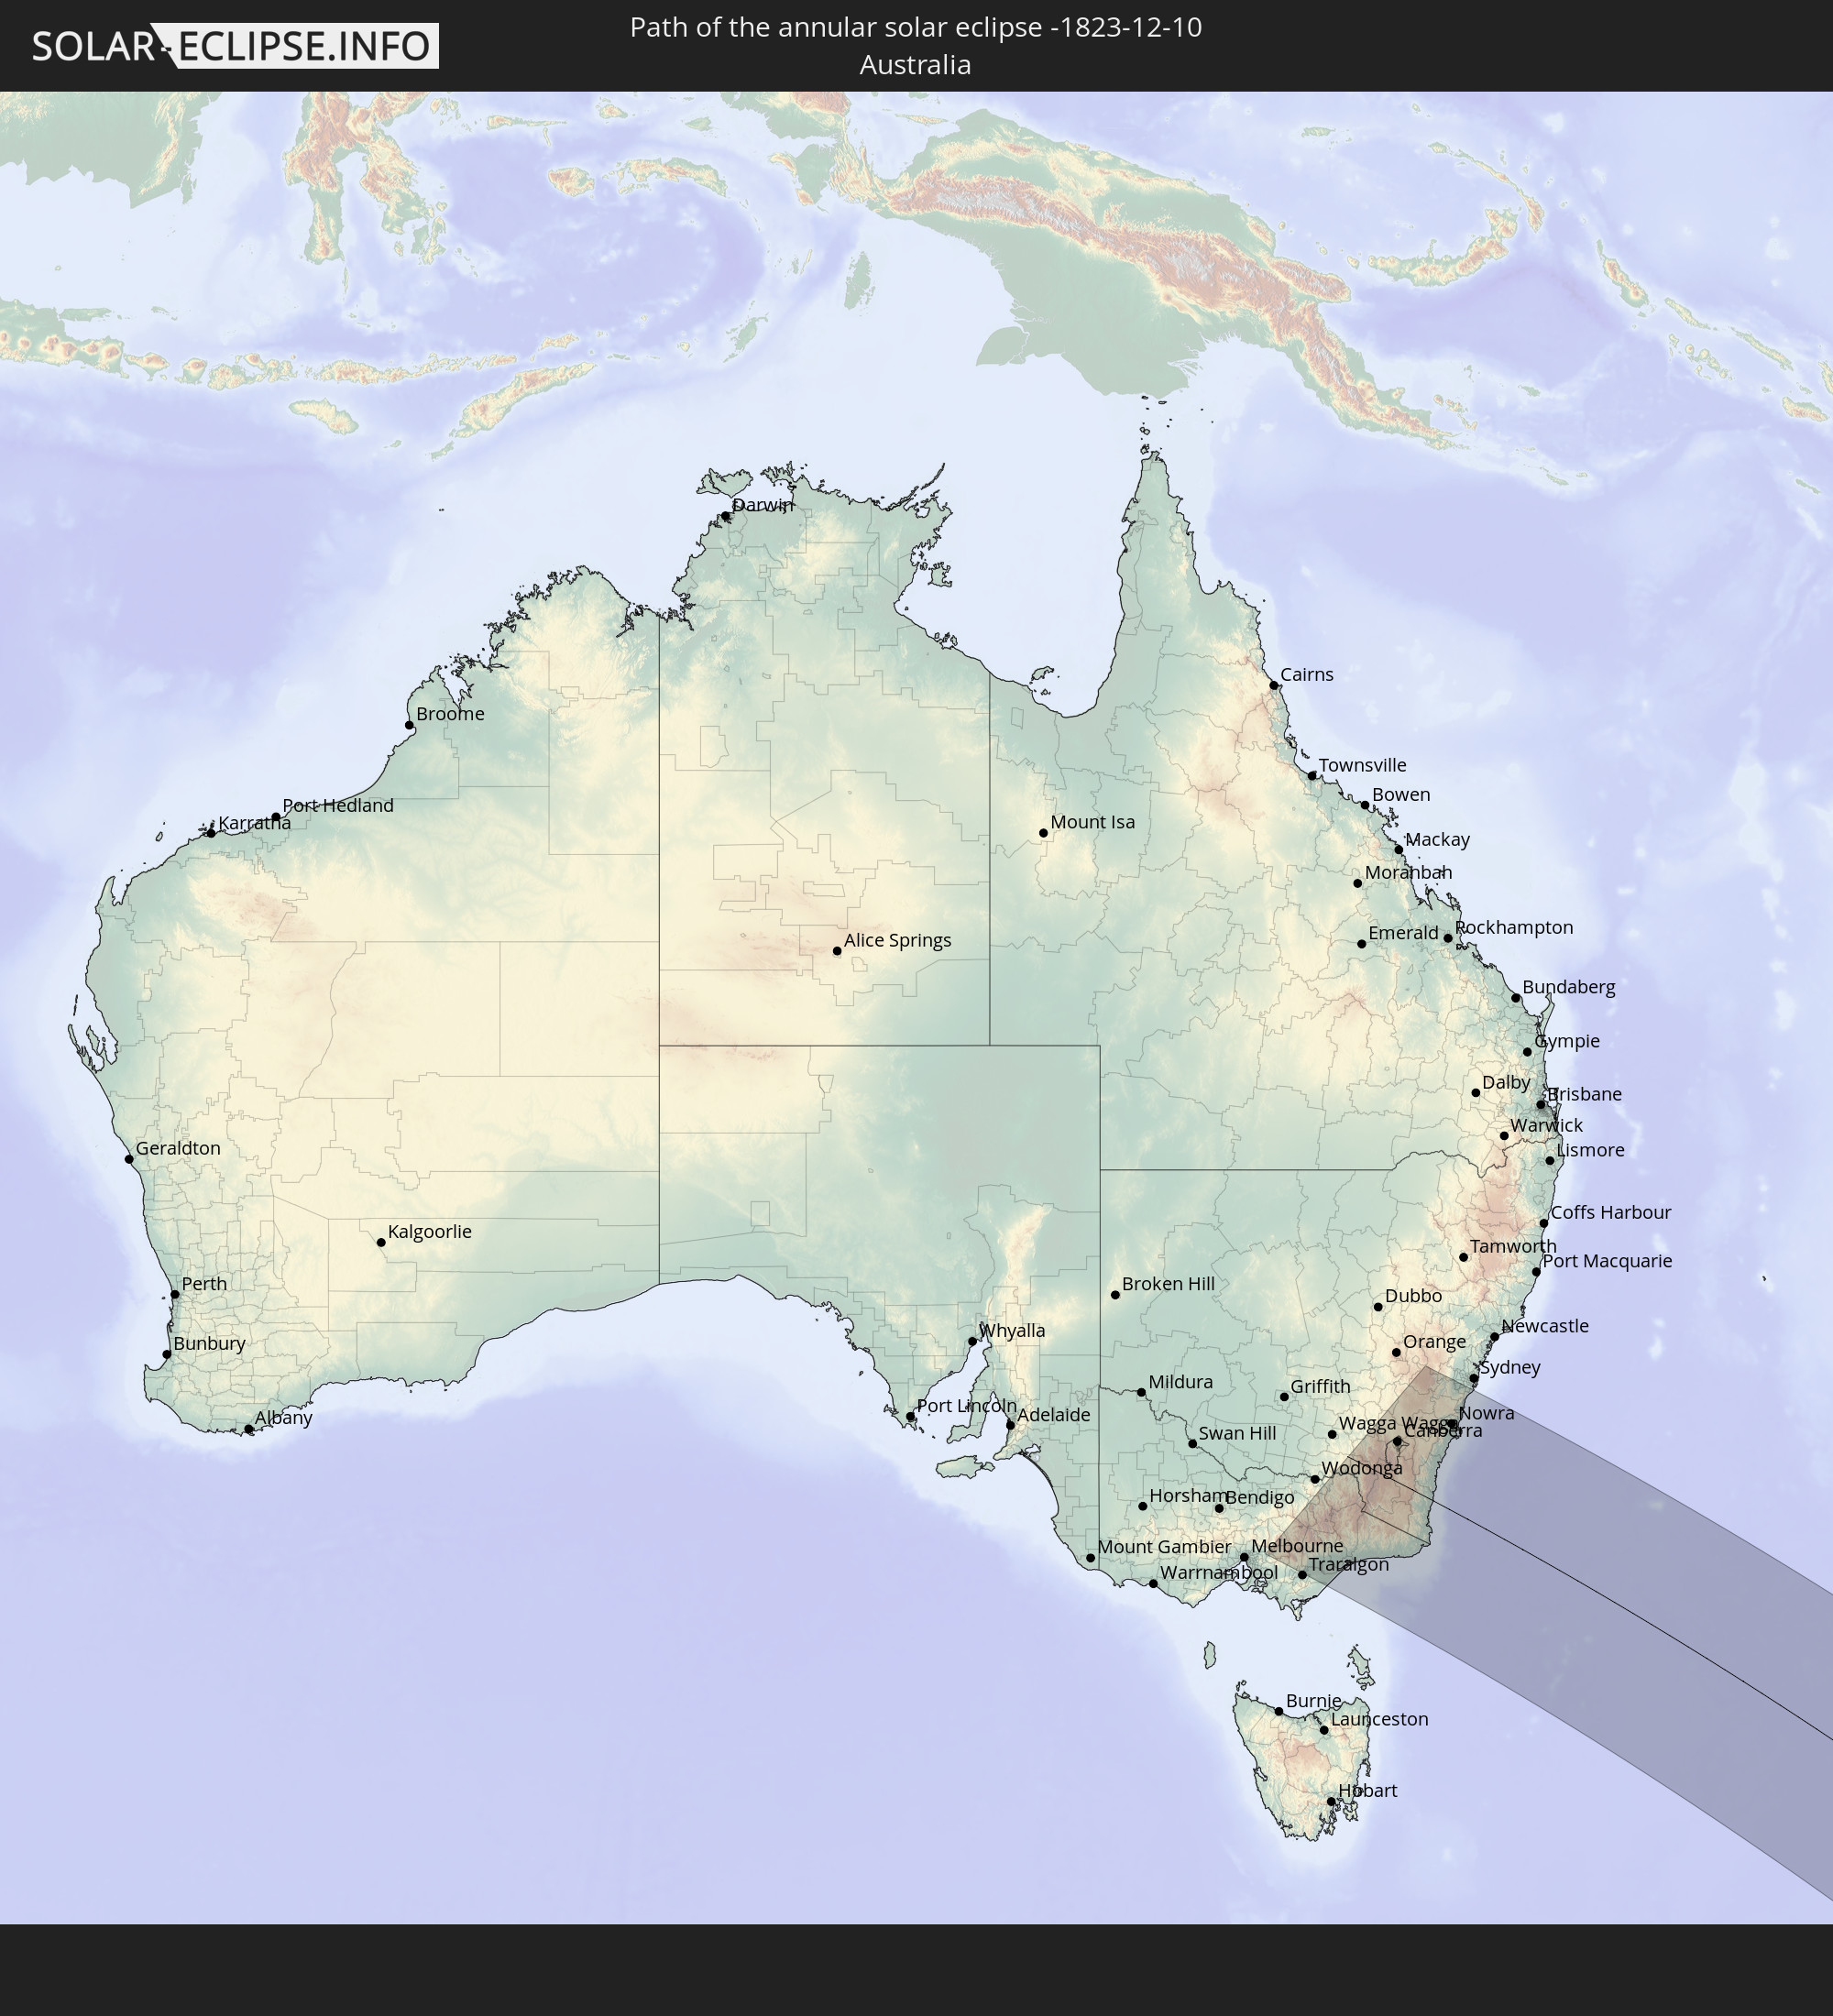 Australia
In den folgenden Ländern ist die Sonnenfinsternis partiell zu sehen
 Fiji
Fiji
 Antarctica
 New Zealand
 Wallis and Futuna
 Tonga
Tonga
 Kiribati
 Samoa
Samoa
 Tokelau
 American Samoa
 Niue
Niue
 Cook Islands
 French Polynesia
 Chile
Chile
 Peru
Peru
 Brazil
 Argentina
 Bolivia
 Paraguay
 Falkland Islands
 Uruguay
 South Georgia and the South Sandwich Islands
 Australia
 Solomon Islands
 New Caledonia
 Vanuatu
 Norfolk Island
 Tuvalu
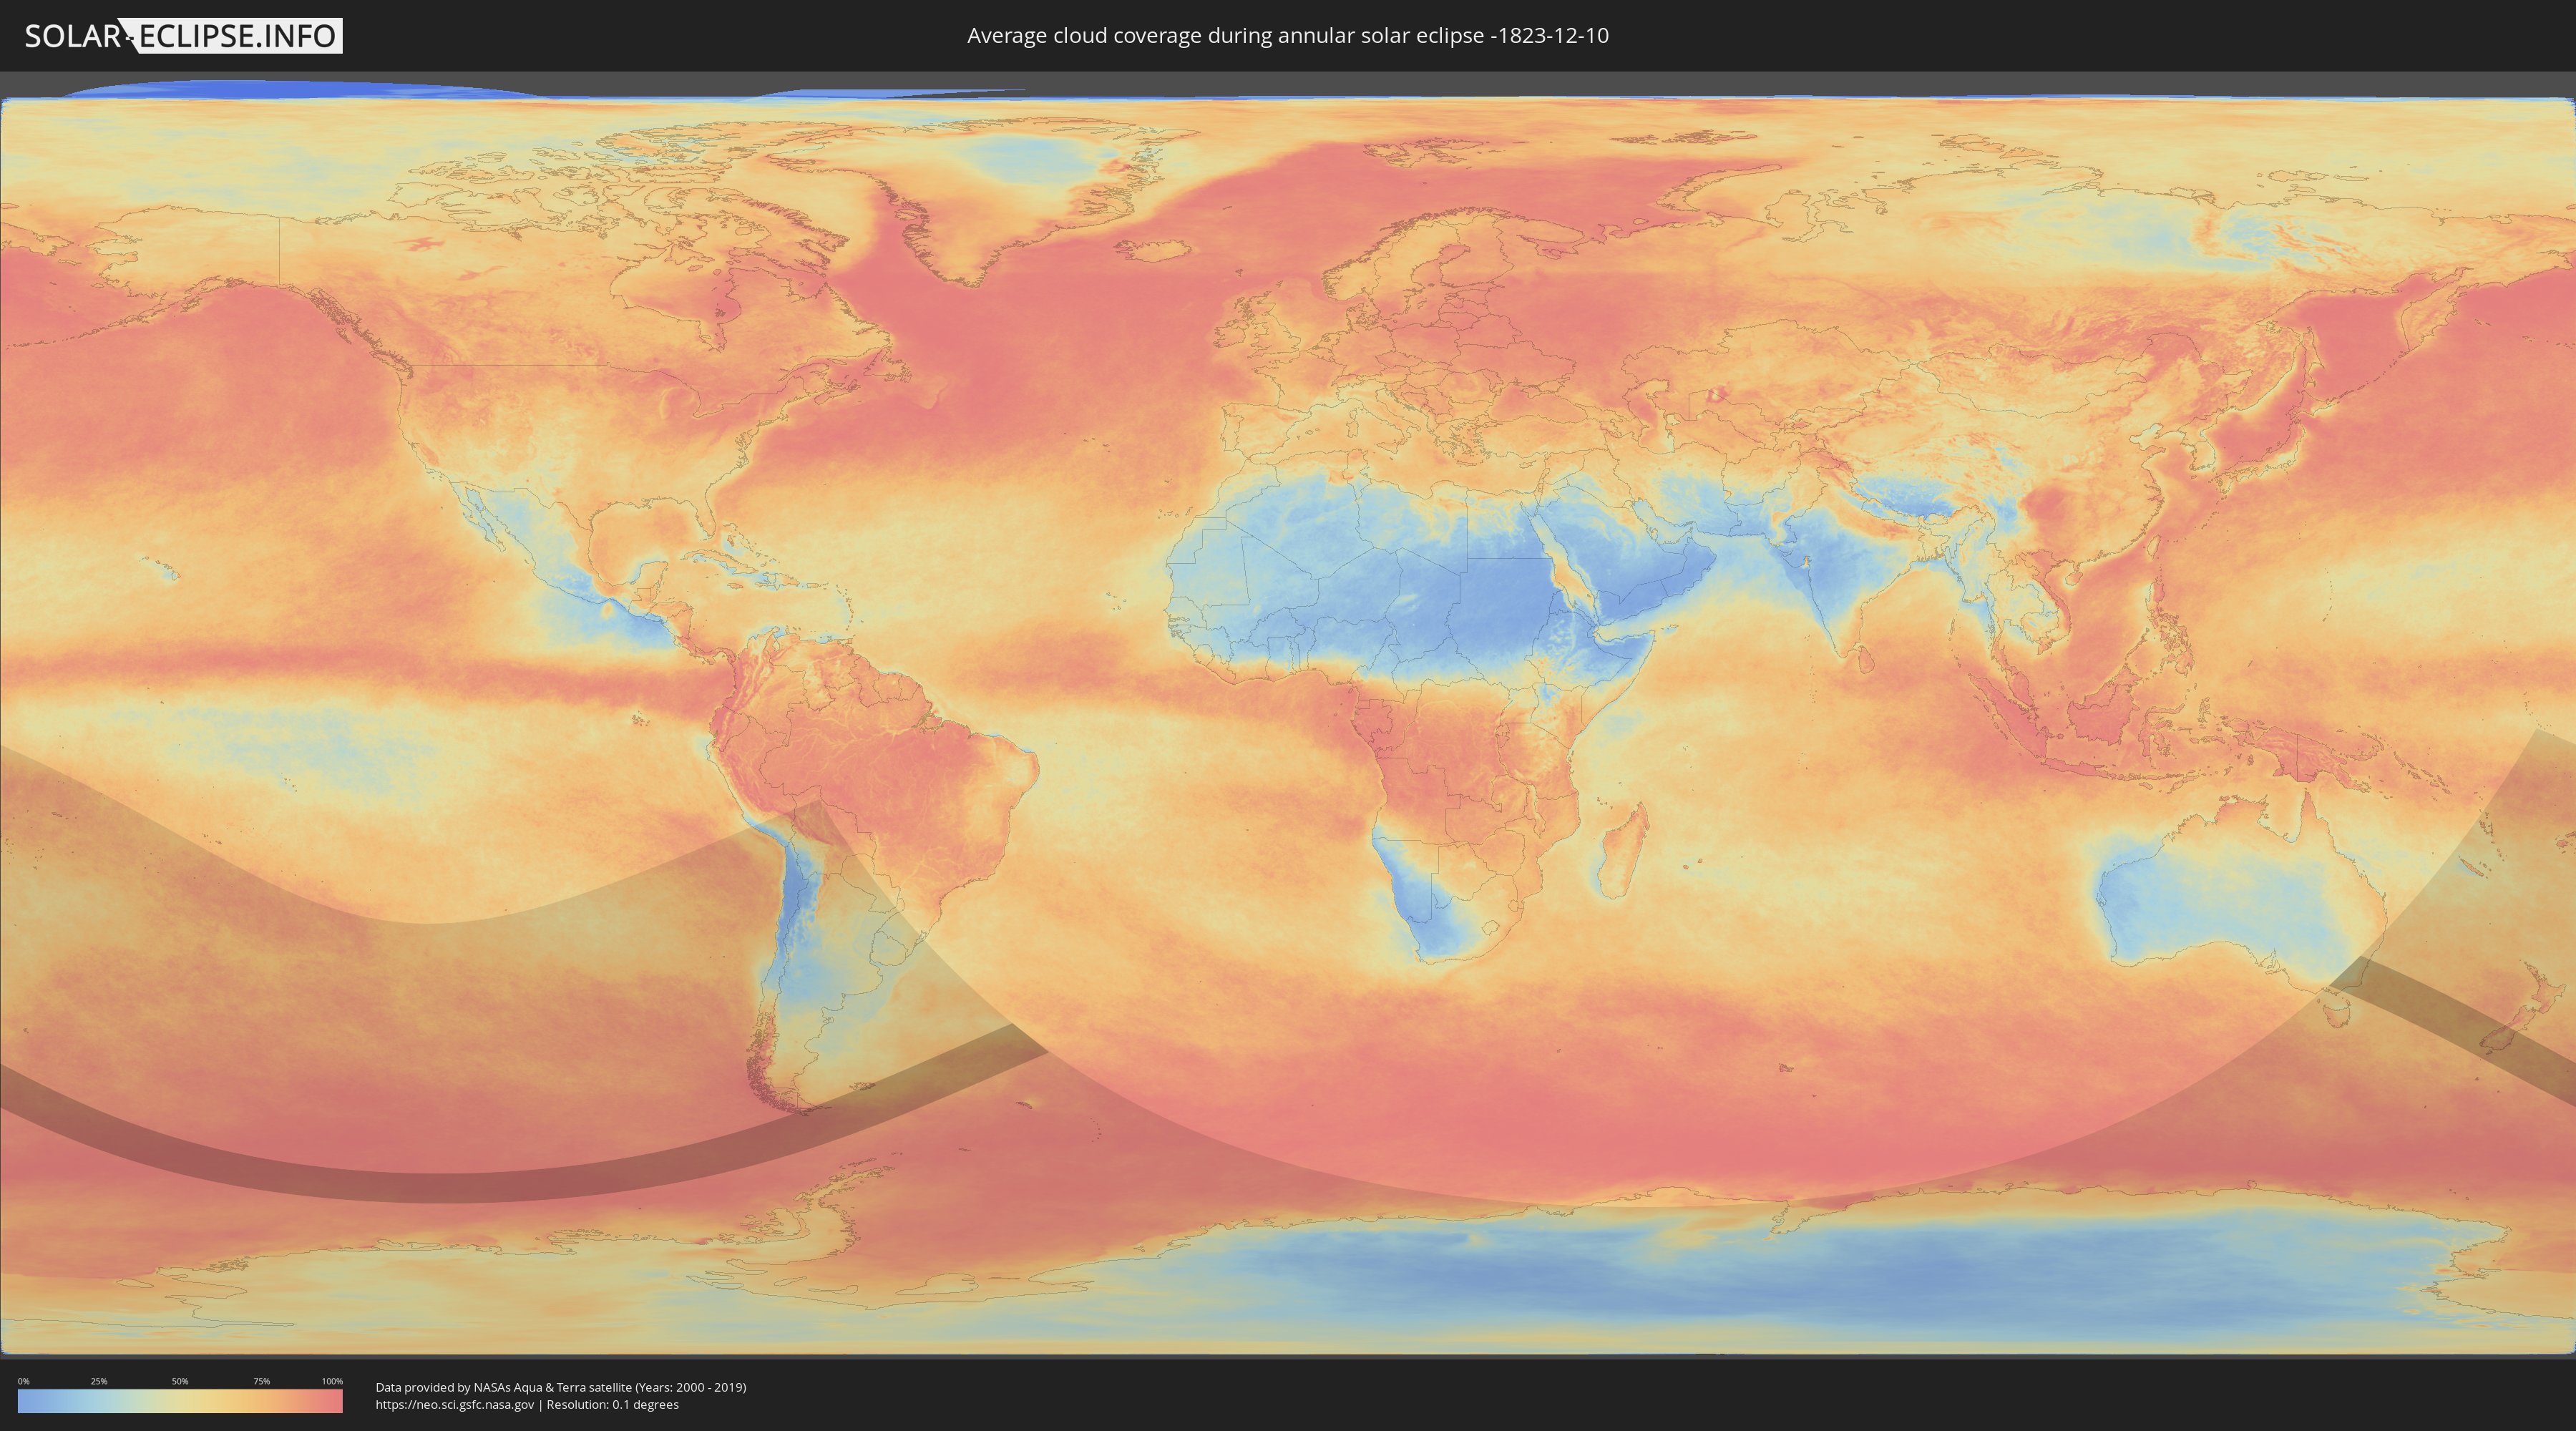
How will be the weather during the annular solar eclipse on 12/10/-1823?
Where is the best place to see the annular solar eclipse of 12/10/-1823?
The following maps show the average cloud coverage for the day of the annular solar eclipse.
With the help of these maps, it is possible to find the place along the eclipse path, which has the best
chance of a cloudless sky.
Nevertheless, you should consider local circumstances and inform about the weather of your chosen
observation site.
The data is provided by NASAs satellites
AQUA and TERRA.
The cloud maps are averaged over a period of 19 years (2000 - 2019).

Detailed country maps
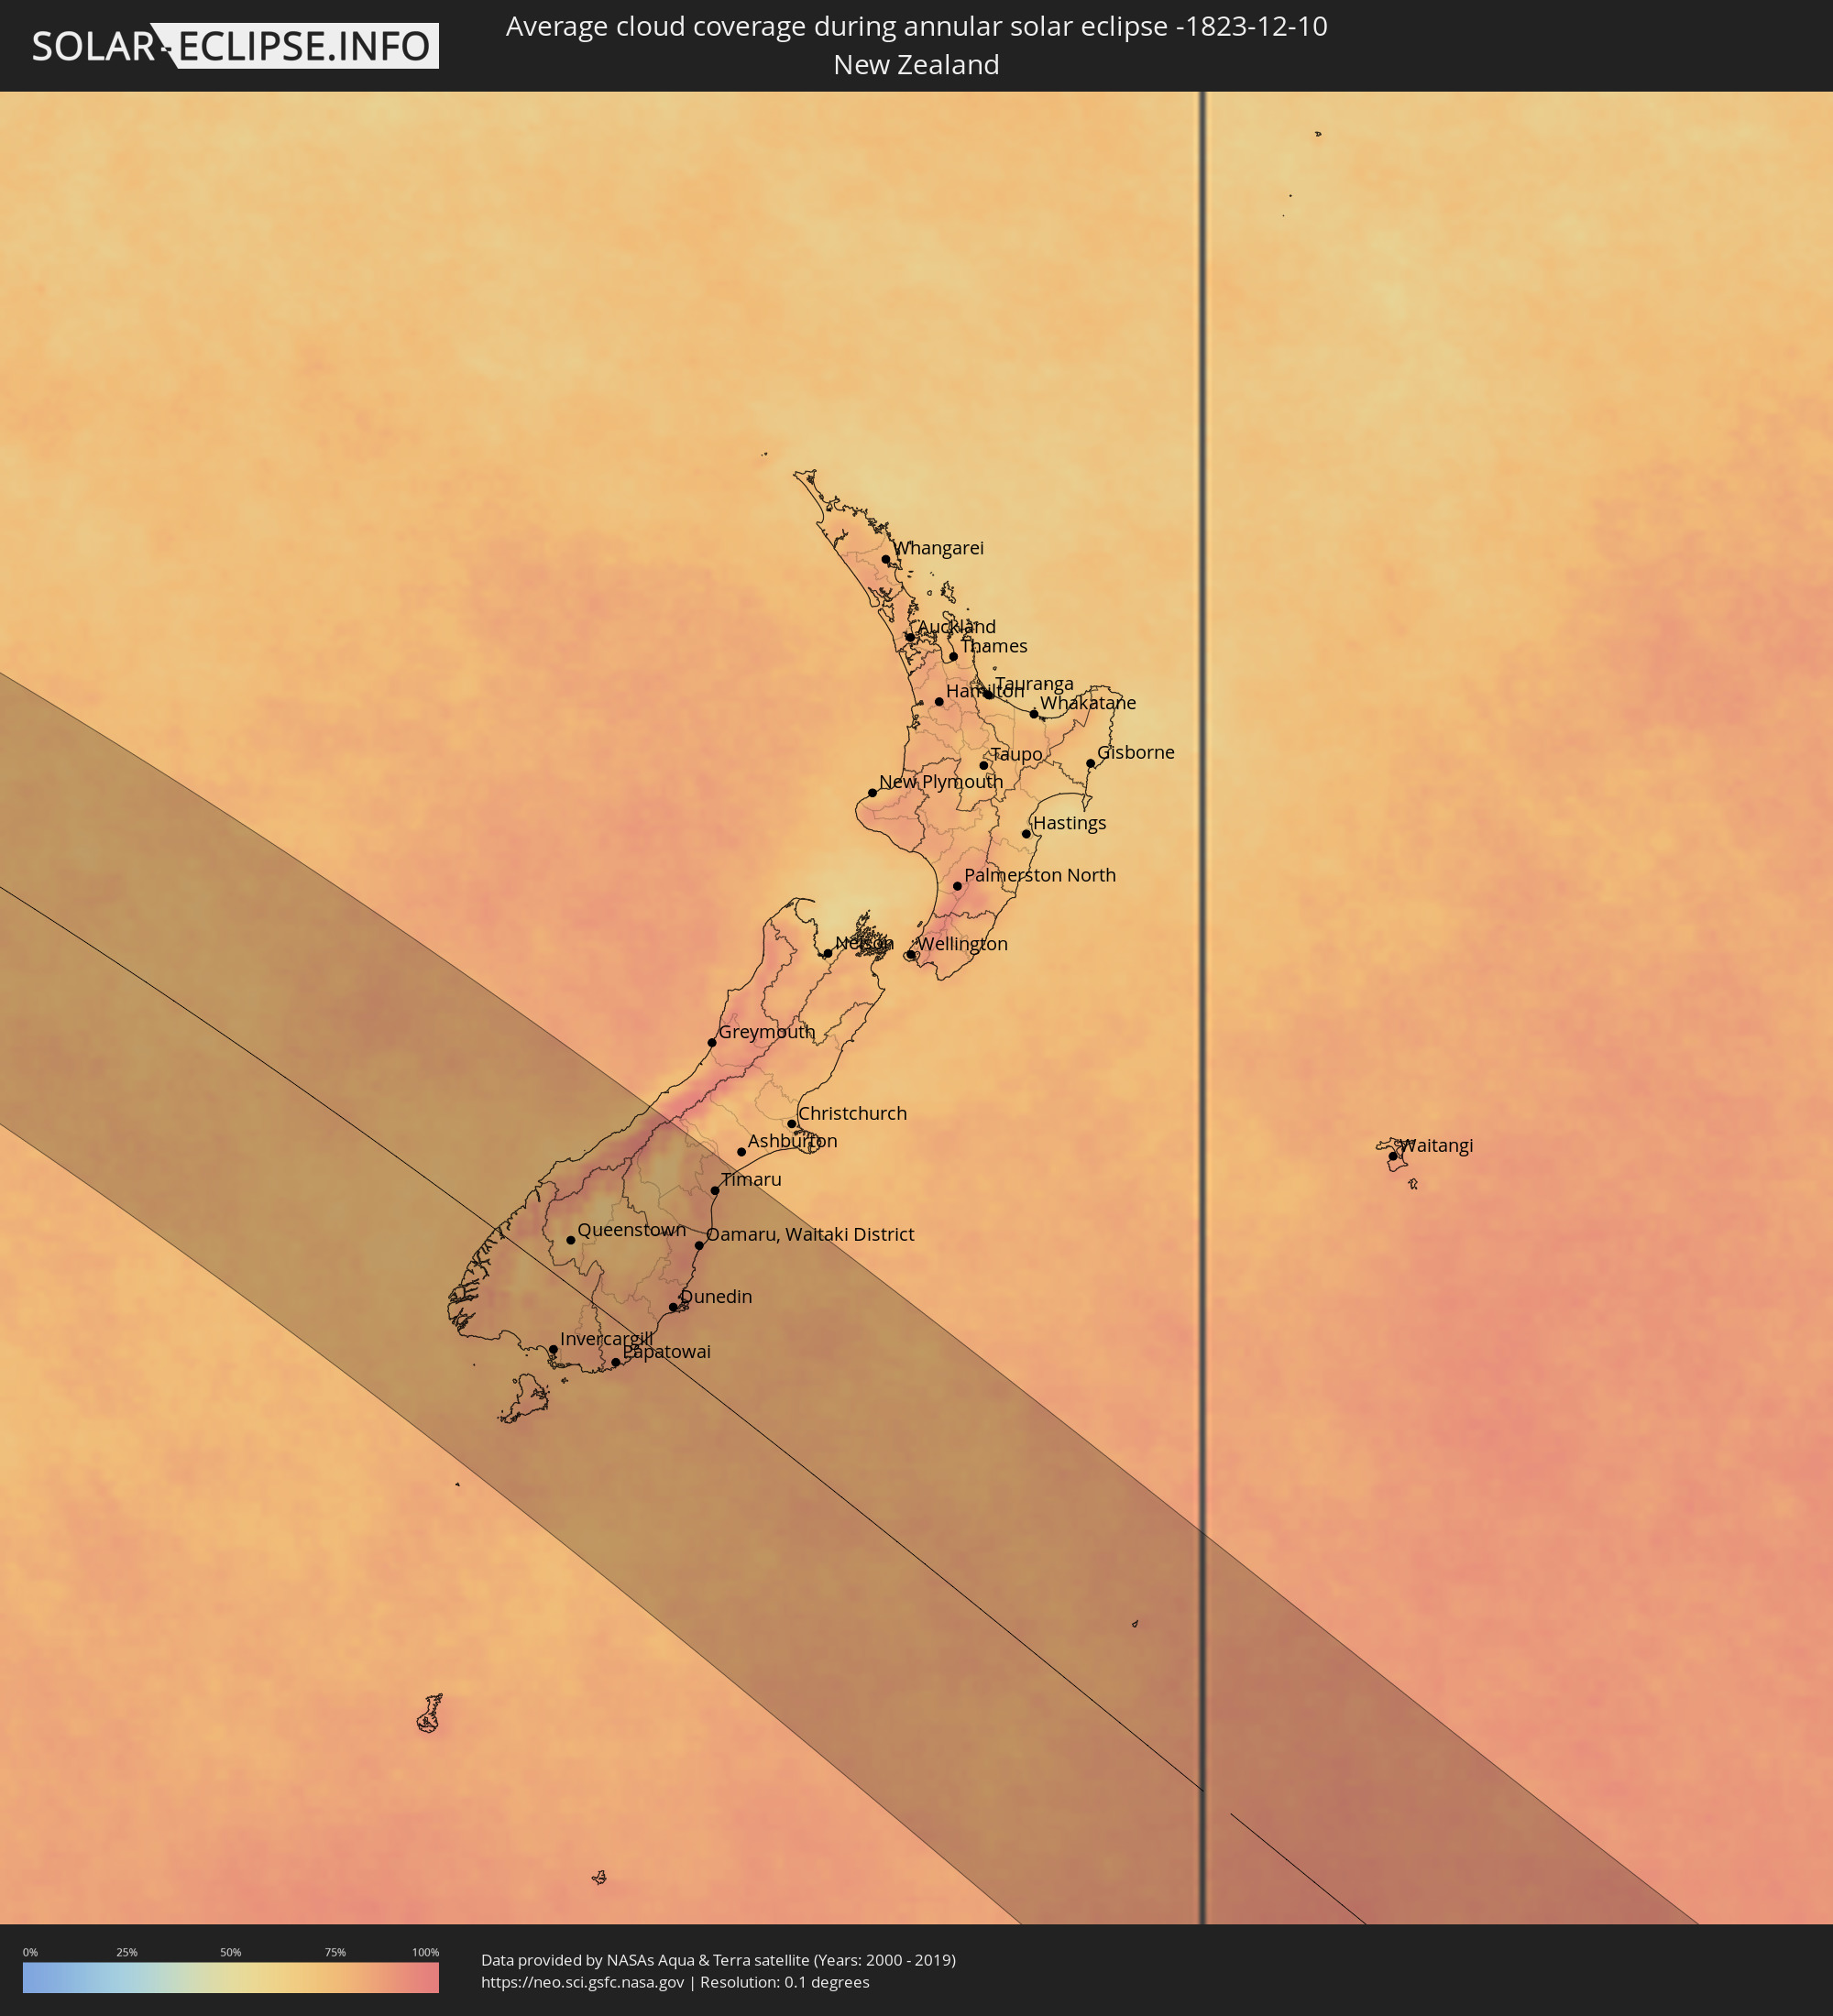 New Zealand
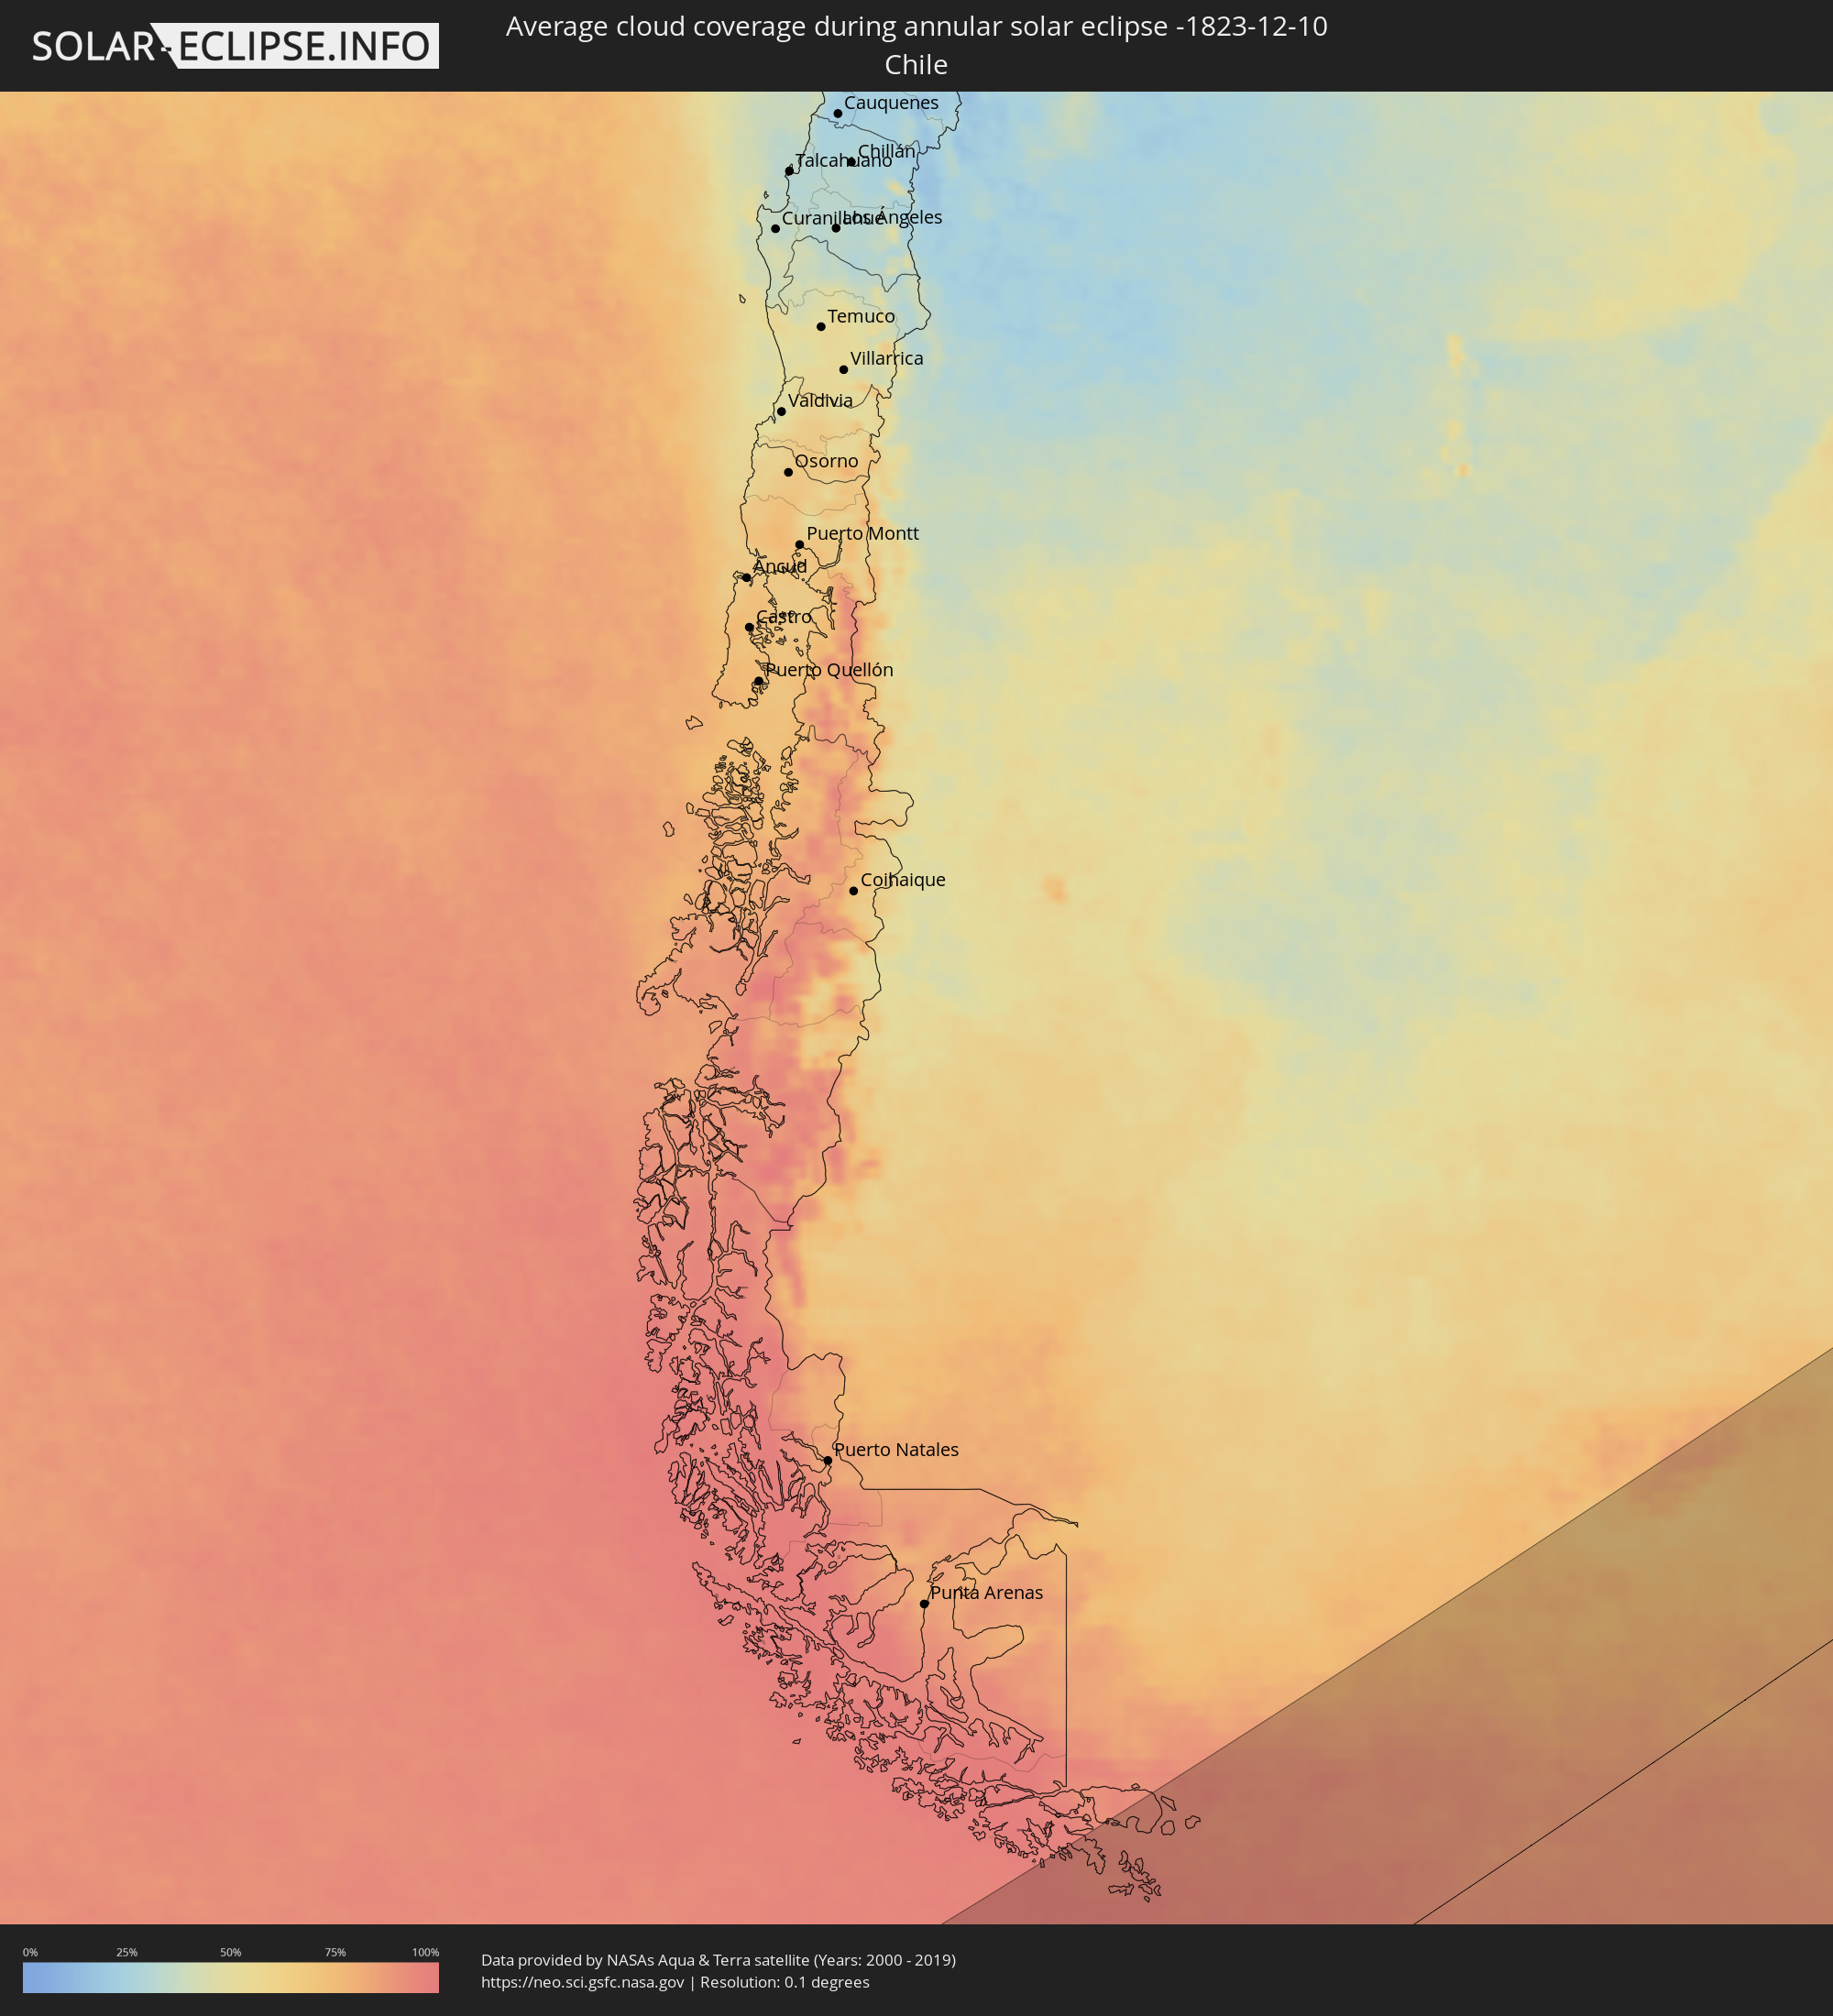 Chile
Chile
 Argentina
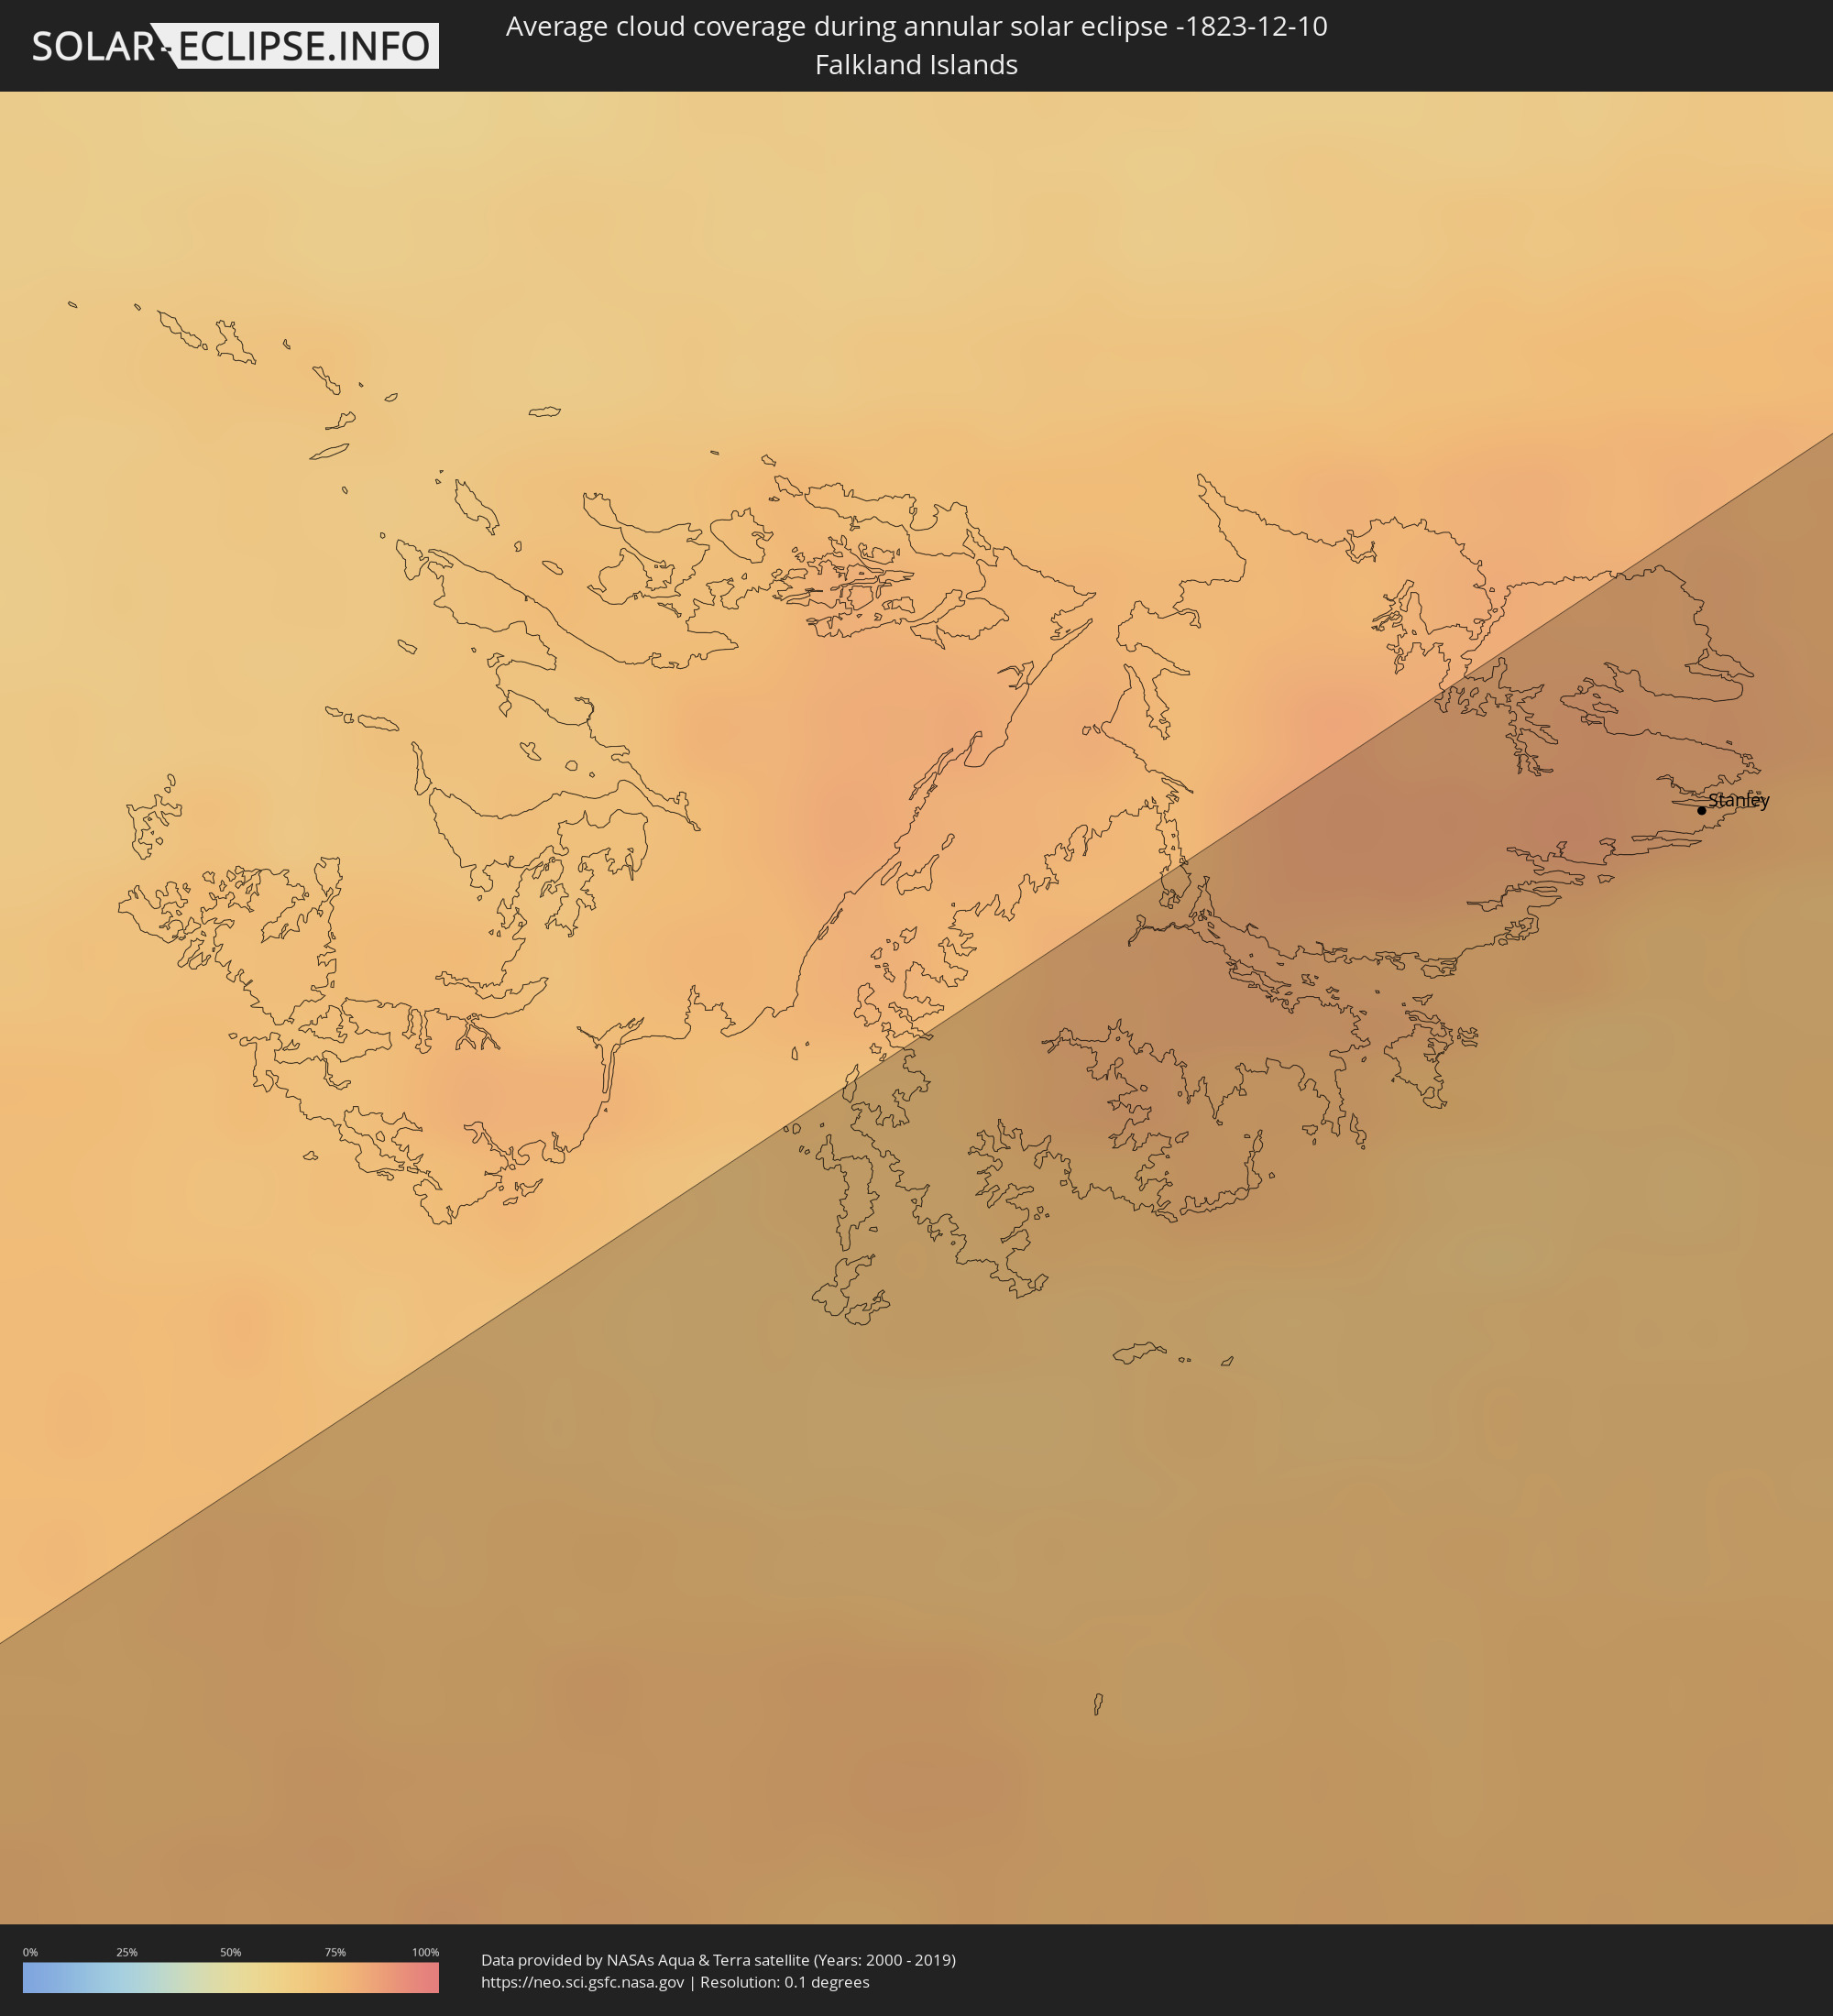 Falkland Islands
 Australia
Cities inside the path of the eclipse
The following table shows all locations with a population of more than 5,000 inside the eclipse path. Cities which have more than 100,000 inhabitants are marked bold. A click at the locations opens a detailed map.
| City | Type | Eclipse duration | Local time of max. eclipse | Distance to central line | Ø Cloud coverage |
|
Stanley
|
annular | - | 17:57:27 UTC-03:51 | 233 km | 74% |
|
Sale, Victoria
|
annular | - | 05:04:25 UTC+10:00 | 277 km | 66% |
|
Bairnsdale, Victoria
|
annular | - | 05:03:47 UTC+10:00 | 227 km | 65% |
|
Lakes Entrance, Victoria
|
annular | - | 05:03:41 UTC+10:00 | 217 km | 59% |
|
Tumut, New South Wales
|
annular | - | 05:00:13 UTC+10:00 | 49 km | 44% |
|
Yass, New South Wales
|
annular | - | 04:59:17 UTC+10:00 | 122 km | 49% |
|
Kaleen, Australian Capital Territory
|
annular | - | 04:59:40 UTC+10:00 | 93 km | 50% |
|
Cooma, New South Wales
|
annular | - | 05:00:58 UTC+10:00 | 18 km | 50% |
|
Canberra, Australian Capital Territory
|
annular | - | 04:59:44 UTC+10:00 | 87 km | 49% |
|
Queanbeyan, New South Wales
|
annular | - | 04:59:47 UTC+10:00 | 87 km | 49% |
|
Goulburn, New South Wales
|
annular | - | 04:58:46 UTC+10:00 | 165 km | 51% |
|
Merimbula, New South Wales
|
annular | - | 05:01:27 UTC+10:00 | 39 km | 64% |
|
Batemans Bay, New South Wales
|
annular | - | 04:59:47 UTC+10:00 | 92 km | 65% |
|
Moss Vale, New South Wales
|
annular | - | 04:58:12 UTC+10:00 | 212 km | 62% |
|
Bowral, New South Wales
|
annular | - | 04:58:05 UTC+10:00 | 222 km | 61% |
|
Mittagong, New South Wales
|
annular | - | 04:58:02 UTC+10:00 | 225 km | 61% |
|
Ulladulla, New South Wales
|
annular | - | 04:59:11 UTC+10:00 | 136 km | 64% |
|
Nowra, New South Wales
|
annular | - | 04:58:31 UTC+10:00 | 188 km | 64% |
|
Bomaderry, New South Wales
|
annular | - | 04:58:28 UTC+10:00 | 192 km | 63% |
|
Narellan, New South Wales
|
annular | - | 04:57:22 UTC+10:00 | 278 km | 61% |
|
Narellan Vale, New South Wales
|
annular | - | 04:57:23 UTC+10:00 | 277 km | 61% |
|
Dapto, New South Wales
|
annular | - | 04:57:56 UTC+10:00 | 234 km | 66% |
|
Albion Park Rail, New South Wales
|
annular | - | 04:58:00 UTC+10:00 | 229 km | 66% |
|
Campbelltown, New South Wales
|
annular | - | 04:57:22 UTC+10:00 | 278 km | 61% |
|
Leumeah, New South Wales
|
annular | - | 04:57:20 UTC+10:00 | 280 km | 61% |
|
Cordeaux Heights, New South Wales
|
annular | - | 04:57:50 UTC+10:00 | 242 km | 66% |
|
Berkeley, New South Wales
|
annular | - | 04:57:53 UTC+10:00 | 239 km | 69% |
|
Kiama, New South Wales
|
annular | - | 04:58:07 UTC+10:00 | 221 km | 63% |
|
Barrack Heights, New South Wales
|
annular | - | 04:57:59 UTC+10:00 | 231 km | 65% |
|
Ingleburn, New South Wales
|
annular | - | 04:57:15 UTC+10:00 | 287 km | 61% |
|
Fairy Meadow, New South Wales
|
annular | - | 04:57:45 UTC+10:00 | 249 km | 69% |
|
Wollongong, New South Wales
|
annular | - | 04:57:47 UTC+10:00 | 246 km | 69% |
|
Corrimal, New South Wales
|
annular | - | 04:57:43 UTC+10:00 | 251 km | 69% |
|
Bulli, New South Wales
|
annular | - | 04:57:40 UTC+10:00 | 255 km | 67% |
|
Helensburgh, New South Wales
|
annular | - | 04:57:25 UTC+10:00 | 275 km | 66% |
|
Engadine, New South Wales
|
annular | - | 04:57:16 UTC+10:00 | 286 km | 61% |
|
Heathcote, New South Wales
|
annular | - | 04:57:18 UTC+10:00 | 285 km | 61% |
|
Invercargill, Southland
|
annular | - | 06:42:38 UTC+11:30 | 85 km | 77% |
|
Queenstown, Otago
|
annular | - | 06:40:11 UTC+11:30 | 56 km | 67% |
|
Gore, Southland
|
annular | - | 06:42:08 UTC+11:30 | 31 km | 80% |
|
Papatowai, Otago
|
annular | - | 06:43:01 UTC+11:30 | 49 km | 83% |
|
Dunedin, Otago
|
annular | - | 06:41:52 UTC+11:30 | 63 km | 85% |
|
Oamaru, Waitaki District, Otago
|
annular | - | 06:40:29 UTC+11:30 | 155 km | 83% |
|
Timaru, Canterbury
|
annular | - | 06:39:15 UTC+11:30 | 230 km | 80% |